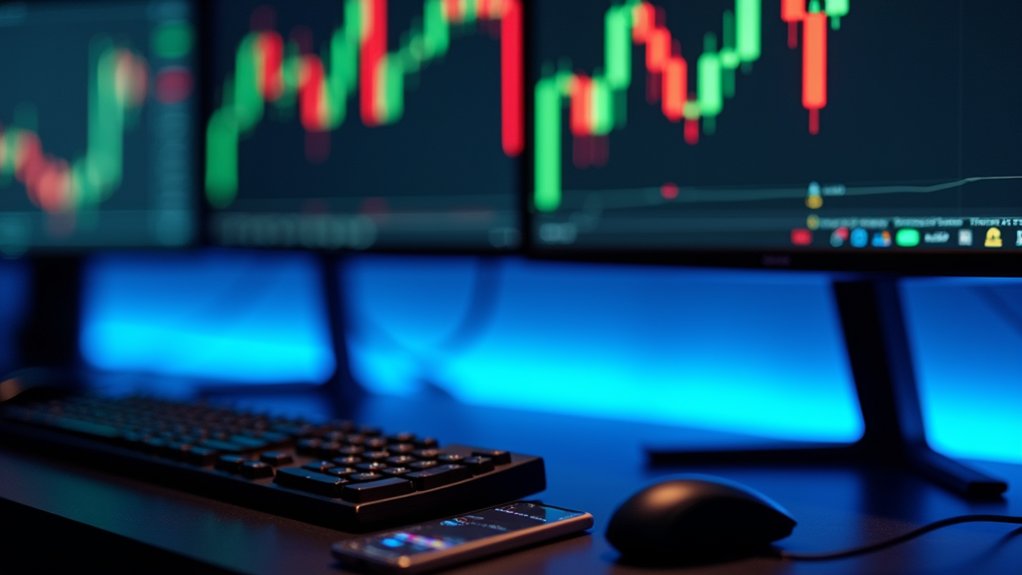
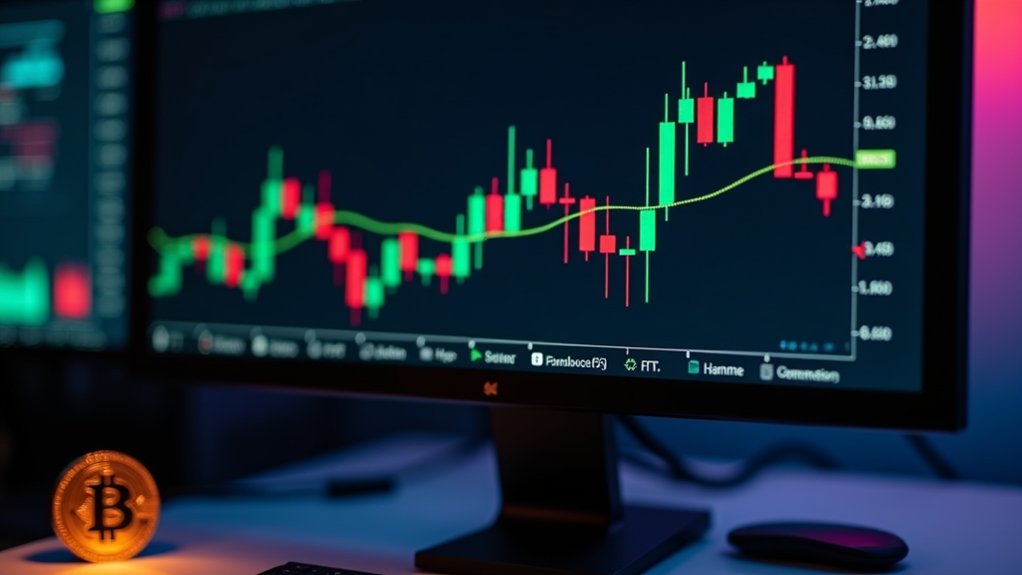
Candlestick charts in cryptocurrency trading convey essential price information through distinct visual elements. The body represents opening and closing prices, with green indicating bullish movement and red signaling bearish trends. Upper and lower shadows show price extremes during the trading period, with longer wicks suggesting increased volatility. Single patterns like Hammers and Dojis, when confirmed with volume analysis and technical indicators, can signal potential reversals. Effective interpretation requires understanding contextual placement near support/resistance zones and market conditions for ideal trading decisions.
Nearly every successful cryptocurrency trader relies on candlestick patterns, the visual representations that distill price action into recognizable formations with predictive qualities. The anatomy of these charts comprises several key components: the body, which displays the opening and closing prices through color differentiation—green or bullish when closing exceeds opening, red or bearish when closing falls below opening; and the shadows or wicks, with the upper shadow representing the highest price achieved during the period and the lower shadow indicating the lowest point reached, where longer shadows typically suggest heightened volatility within the timeframe. Timeframe selection significantly impacts trading strategy effectiveness, with short-term timeframes being more suitable for day traders seeking quick opportunities.
Single-candle formations like the Hammer and Inverted Hammer frequently signal potential reversals in downtrends, distinguished by their long lower and upper shadows respectively, while multi-candle patterns like the Piercing Line—where a bullish candle penetrates at least half the body of the preceding bearish candle—indicate gathering buying momentum. The Three White Soldiers pattern, consisting of three consecutive long bullish candles, suggests strong upward momentum; however, traders must exercise caution as this formation proves particularly susceptible to false signals in cryptocurrency markets characterized by low liquidity. The Bullish Harami Candle appears as a smaller bullish candle contained within a larger bearish candle, indicating weakening selling pressure and a possible trend reversal.
Key reversal patterns like the Hammer require validation in crypto's volatile landscape, where even strong formations can mislead in thin markets.
Cryptocurrency's unique 24/7 trading environment intensifies both pattern frequency and price volatility, necessitating stringent validation procedures for candlestick signals through multi-timeframe analysis. Confirmation techniques, consequently, become essential: volume analysis helps identify genuine momentum shifts; moving averages validate trend direction when prices cross above or below critical levels; and oscillators like RSI divergences or MACD crossings confirm candlestick signals, reducing false positives. Implementing stop-loss orders when trading based on candlestick patterns is crucial for protecting capital during unexpected market reversals.
The contextual placement of patterns considerably influences their interpretative value, since exemplified by the Doji candle, which indicates market indecision but transforms into a potential bullish signal when appearing near support zones with substantial volume.
Ultimately, effective candlestick analysis in cryptocurrency markets demands an integrated approach, combining pattern recognition with technical indicators, volume assessment, and support/resistance identification, while remaining cognizant of crypto-specific factors such as liquidity constraints and potential market manipulation by large holders commonly known as "whales."
Frequently Asked Questions
How Do Candlesticks Differ Between Crypto and Traditional Markets?
Cryptocurrency candlesticks differ from traditional markets in four key aspects:
- Market hours, with crypto trading 24/7 versus scheduled sessions;
- Volatility, since crypto exhibits longer wicks and wider price ranges;
- Fundamental influences, where crypto responds to on-chain metrics while stocks correlate with earnings reports;
- Pattern reliability, with crypto requiring stronger volume confirmation and additional technical validation due to potential market manipulation and extreme price fluctuations.
Can Candlestick Patterns Predict Crypto Market Crashes?
Candlestick patterns can indicate potential crypto market crashes, though with significant limitations.
While formations like Three Black Crows and Bearish Engulfing patterns preceded major downturns in 2018 and 2022, they provide no absolute certainty due to crypto's fundamental volatility and manipulation risks.
For improved predictive accuracy, analysts recommend supplementing candlestick analysis with volume confirmation, multi-timeframe perspectives, and on-chain metrics rather than relying on patterns in isolation.
How Reliable Are Candlestick Patterns During Extreme Market Volatility?
Candlestick patterns demonstrate considerably diminished reliability during extreme market volatility, with their predictive capacity compromised by false signals, liquidity disparities, and artificial price movements.
Single-candle formations prove particularly unreliable compared to multi-candle patterns, which require robust confirmation through supplementary indicators.
Traders seeking meaningful insights during turbulent conditions must employ mitigation strategies, including volume analysis, multi-timeframe approaches, and sentiment assessment, rather than depending exclusively on candlestick formations in isolation as standalone decision-making tools.
Which Candlestick Timeframes Work Best for Day Trading Crypto?
For day trading cryptocurrency, ideal timeframes include M5 charts for balance between detail and signal clarity, M15 charts for identifying intraday trends while filtering market noise, and H1 charts for contextual market direction.
During high-volume periods when European and American sessions overlap, traders often employ a multi-timeframe approach, using H1 charts for trend identification and M5-M15 charts for precise entry and exit points, particularly when monitoring candlestick patterns like engulfing formations and Marubozu candles.
Do Automated Trading Bots Recognize Candlestick Patterns Effectively?
Modern trading bots effectively recognize candlestick patterns through sophisticated algorithms, integrating with platforms like TradingView to execute trades based on predefined formations.
These automated systems excel on higher timeframes (1-hour, 4-hour) where patterns demonstrate greater reliability, while offering advantages including 24/7 monitoring capability and emotion-free execution.
However, their effectiveness remains contingent upon proper configuration with confirmatory indicators, since standalone pattern recognition can generate false signals during volatile market conditions.